

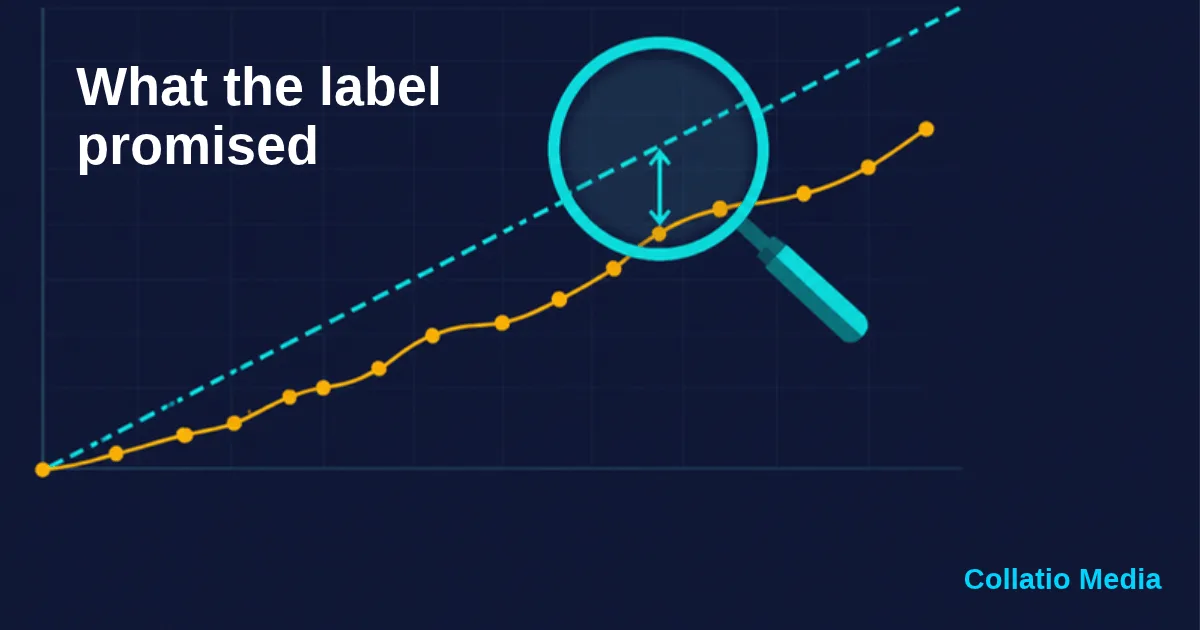
Between 18 September and 27 October 2026, Betting Tips AI published and settled 523 soccer tips that could be graded against a final score. The average confidence printed on them was 70.0%. A tip stamped 70% promises about seven wins in ten. So 523 of them should have produced roughly 366 winners.
They produced 308. That is a hit rate of 58.9%, a shortfall of 58 tips. Treat every tip as an independent 70% event and the shortfall sits more than five standard deviations below expectation. Tips from the same round are not fully independent, so read that as a strong hint, not a proof. The 95% interval for the true hit rate, 54.6 to 63.0%, does not reach 70% either.
- Settled tips
- 523
- Winners
- 308 (58.9%)
- Average stated
- 70.0%
- Expected winners
- about 366
What the label is supposed to mean
Calibration is the match between a stated probability and how often the event happens. Take every forecast labelled 80%. About 80% of them should come true. The scikit-learn documentation on probability calibration plots this as a calibration curve: predictions go into bins, with the average predicted probability on the x-axis and the observed fraction of positives on the y-axis. On that plot a perfectly calibrated model would trace the line where the two are equal.
Calibration and accuracy are separate. A model can pick winners often and still print the wrong odds on them. Scoring rules such as Brier score and log loss grade the probabilities themselves. Guo and colleagues found in 2017 that modern neural networks are poorly calibrated. Xiong and colleagues reported in 2023 that language models asked for a confidence tend to be overconfident. The tips in this table come from the second kind of system.
Where the confidence number comes from
Each tip is written by Google's Gemini 2.5 Flash-Lite with Google Search switched on. The model gets the fixture details and searches the web for team news. It returns the whole card in one go: three outcome probabilities, a pick, a confidence and the analysis text. Bookmaker odds are not part of the input. No statistical rating system sits behind it. The confidence stored with the tip comes out of that same single output.
The prompt also says where to land: most confidences between 0.65 and 0.80, with 0.85 to 0.90 kept for mismatches. The data follows the instruction. Of the 523 tips, 422 (81%) carry a confidence between 65% and 79%.
The tableSix bins, one uncomfortable column
Tips are grouped by the confidence printed on them. The table shows how many fell in each group, how many won, the average stated confidence and a 95% interval for the true hit rate. The interval matters because several bins are small. It is a Wilson score interval, which holds up better than the textbook formula on small samples.
| Stated confidence | Tips | Winners | Hit rate | Average stated | 95% interval |
|---|---|---|---|---|---|
| Under 60% | 33 | 12 | 36.4% | 48.7% | 22.2 to 53.4% |
| 60 to 64% | 30 | 19 | 63.3% | 60.5% | 45.5 to 78.1% |
| 65 to 69% | 143 | 86 | 60.1% | 65.2% | 52.0 to 67.8% |
| 70 to 74% | 78 | 41 | 52.6% | 70.2% | 41.6 to 63.3% |
| 75 to 79% | 201 | 120 | 59.7% | 75.0% | 52.8 to 66.2% |
| 80% and over | 38 | 30 | 78.9% | 86.4% | 63.7 to 88.9% |
| All tips | 523 | 308 | 58.9% | 70.0% | 54.6 to 63.0% |
Two bins carry the damage
The 279 tips labelled 70 to 79% averaged a stated confidence of 73.7%. They won 161 times, a hit rate of 57.7%.
The interval runs from 51.8 to 63.4%, and the stated 73.7% sits well outside it. The four other bins have intervals wide enough to include their labels, which says more about sample size than about the model: they hold 30 to 143 tips each. The 38 tips labelled 80% or more won 30 and behave best, though a group that small proves little in either direction.
Turning the dial up barely helps
Tips with a confidence of at least 65% won 60.2% of the time (277 of 460). At least 70%: 60.3% (191 of 317). At least 75%: 62.8% (150 of 239). Only the small top group looks different. Read as a ranking, the confidence number separates the very top from the rest and very little in between.
One model, one sport, 523 tips, 40 days. Of 539 finished matches with a ready tip, 16 were left out because the query cannot grade them. Ten had an empty pick and six carried labels such as double chance. The stored confidence is partly derived from the model's own three probabilities, so it is one opinion, not two. Treat every row as a first reading.
Calibration is half the question
A tip can be well calibrated and still lose money, because the price decides what pays. The break-even math for AI betting tips shows how far a hit rate must climb at typical odds. Whether a pick beats the market is a separate test, measured with closing line value. These tips are graded against final scores, not prices.
Language models also vary from run to run. Sampled at a non-zero temperature, the same fixture can return a different confidence on a second pass. It is the variance behind why AI gives different answers every time. This article measures one product's tips, while the research review on whether ChatGPT can predict sports results covers what published studies found.
MethodReproduce it
Collatio Media publishes Betting Tips AI, and the table comes straight from its database. The query is read-only. It covers finished soccer matches that had a ready tip, a final score and a tip generated before kickoff, with kickoff before 28 October 2026. It grades match-winner, totals and both-teams-to-score tips, groups them by stated confidence and computes the Wilson interval for each group. It was run on 28 October 2026.
Expected winners equal the 523 tips multiplied by the average stated confidence. The deviation figure assumes independent tips and uses the binomial standard deviation: the square root of n times p times one minus p. With varied confidences, that simplification makes the shortfall look slightly smaller than it is.
The query
with base as (
  select id, home_team_name h, away_team_name a, home_score hs, away_score aw, prediction_confidence conf,
         lower(coalesce(prediction_primary_label,'')) lbl, prediction_markets->0->'structure' st
  from sports_matches
  where sport::text='soccer' and status::text='finished' and prediction_status::text='ready'
    and home_score is not null and away_score is not null
    and prediction_generated_at < kickoff_utc and prediction_confidence > 0
    and kickoff_utc < '2026-10-28'
), s as (
  select *, case
    when st->>'type'='moneyline' and st->>'side'='home' then (hs>aw)
    when st->>'type'='moneyline' and st->>'side'='away' then (aw>hs)
    when st->>'type'='moneyline' and st->>'side'='draw' then (hs=aw)
    when st->>'type'='total' and st->>'direction'='over'  then (hs+aw > (st->>'threshold')::numeric)
    when st->>'type'='total' and st->>'direction'='under' then (hs+aw < (st->>'threshold')::numeric)
    when st->>'type'='btts' and st->>'btts'='yes' then (hs>0 and aw>0)
    when st->>'type' is null and lbl ~ '^over [0-9.]+ goals'  then (hs+aw > substring(lbl from '^over ([0-9.]+)')::numeric)
    when st->>'type' is null and lbl ~ '^under [0-9.]+ goals' then (hs+aw < substring(lbl from '^under ([0-9.]+)')::numeric)
    when st->>'type' is null and lbl like 'both teams to score%yes%' then (hs>0 and aw>0)
    when st->>'type' is null and lbl = 'draw' then (hs=aw)
    when st->>'type' is null and lbl like '% to win' and position(lower(h) in lbl)>0 and position(lower(a) in lbl)=0 then (hs>aw)
    when st->>'type' is null and lbl like '% to win' and position(lower(a) in lbl)>0 and position(lower(h) in lbl)=0 then (aw>hs)
    else null end as hit
  from base
), b as (
  select case when conf<0.60 then '0 under 60' when conf<0.65 then '1 60-64' when conf<0.70 then '2 65-69'
              when conf<0.75 then '3 70-74' when conf<0.80 then '4 75-79' else '5 80 plus' end bin, conf, hit
  from s where hit is not null
), agg as (select bin, count(*) n, count(*) filter (where hit) k, avg(conf) mc from b group by bin)
select bin, n, k hits, round(100.0*k/n,1) hit_pct, round(100*mc,1) mean_stated_pct,
  round(100*((k::numeric/n + 3.8416/(2*n)) / (1+3.8416/n) - 1.96*sqrt((k::numeric/n)*(1-k::numeric/n)/n + 3.8416/(4*n*n))/(1+3.8416/n)),1) wilson_lo,
  round(100*((k::numeric/n + 3.8416/(2*n)) / (1+3.8416/n) + 1.96*sqrt((k::numeric/n)*(1-k::numeric/n)/n + 3.8416/(4*n*n))/(1+3.8416/n)),1) wilson_hi
from agg order by bin;