

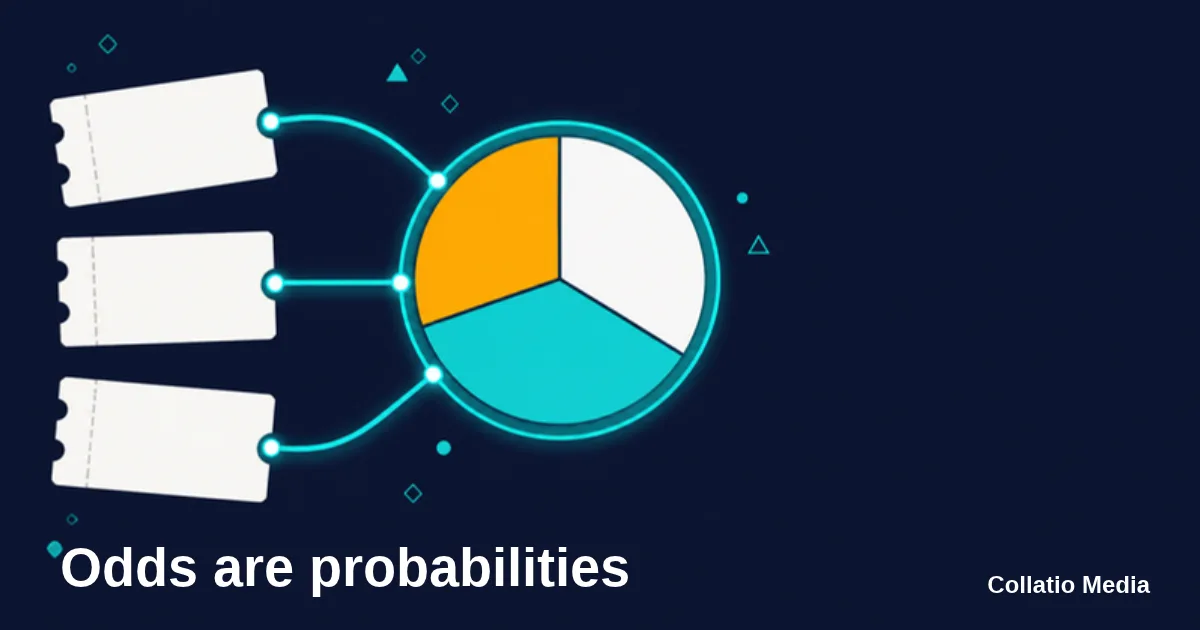
On the afternoon of 27 October 2026, Pinnacle was offering 4.85 on Torino, 3.86 on the draw and 1.76 on Como. Como won 3-1. Before a ball was kicked, those three prices already held a small puzzle: the chances they imply add up to 103.34%.
Step oneA price is a probability in disguise
A decimal price is the payout for one unit staked, stake included. Divide one by the price and you get the chance the outcome needs for the bet to break even. Como at 1.76 needs 56.8%. Torino at 4.85 needs 20.6%. The draw at 3.86 needs 25.9%.
Fractional and American prices carry the same information in other clothes. Wikipedia's article on odds gives the conversions. A fractional price of a/b implies b ÷ (a + b). Positive American odds of +X imply 100 ÷ (X + 100), and negative odds of -X imply X ÷ (X + 100).
| Decimal | Fractional | American | Break-even chance |
|---|---|---|---|
| 1.50 | 1/2 | -200 | 66.7% |
| 1.75 | 3/4 | -133 | 57.1% |
| 2.00 | 1/1 | +100 | 50.0% |
| 2.50 | 3/2 | +150 | 40.0% |
| 3.00 | 2/1 | +200 | 33.3% |
| 4.00 | 3/1 | +300 | 25.0% |
| 5.00 | 4/1 | +400 | 20.0% |
Check any row by hand: 1 ÷ 3.00 is 0.333, so 33.3%. American odds are rounded to the nearest whole number.
Where the extra 3.34% comes from
Add the three break-even chances for the match: 0.2062, 0.2591 and 0.5682. They sum to 1.0334 before rounding (the four-place figures shown add to 1.0335). In a fair market they would sum to exactly 1. The 0.0334 left over is the overround, the margin the bookmaker has built into the prices. Wikipedia's entry on the mathematics of bookmaking defines it as the amount by which the book exceeds 100%.
No bookmaker prints the margin on the slip. It has to be computed.
Two ways to take it out
Compared with the raw 56.8%, a forecast of 55% for Como looks like a disagreement with the market. Compared with the margin-free 54.98%, it is the same view. Any comparison between a bookmaker and a forecast, such as scoring probabilities with Brier score and log loss, needs the margin removed first.
Proportional
- Divide each implied chance by the book total, 1.0334 here.
- Torino 19.95%, draw 25.07%, Como 54.98%.
- Scales every outcome by the same factor.
Power
- Raise each implied chance to a power k, chosen so the three sum to 1. Here k is about 1.034.
- Torino 19.53%, draw 24.74%, Como 55.73%.
- Takes more from the long shots and leaves the favourite with more.
On this match the two methods differ by 0.75 points for Como. The way they split the margin between favourites and long shots is why researchers keep proposing alternatives. Clarke, Kovalchik and Ingram (2017) compared four methods, including Shin's iterative approach. They argue that proportional scaling ignores the favourite-longshot bias. Their power method beat it on three datasets and matched or beat Shin's.
A 2026 arXiv paper pitted a new odds-only method against the multiplicative, Shin and power methods on 90,014 football matches from five bookmakers. The new method came out ahead for most of the five. The open-source penaltyblog package ships seven methods and defaults to the multiplicative one. Its own example, prices of 2.70, 2.30 and 4.40, carries a 3.24% margin.
Average margin 6.93%, Pinnacle 4.10%
Collatio Media stores the odds feed behind Betting Tips AI. Each soccer match in it carries a snapshot of home, draw and away prices from about 20 bookmakers. Take every book's margin the way the Torino example did, average across the books, and each match gets one number. Matches priced by fewer than five bookmakers are left out, which removed four matches.
- Matches
- 494
- Average margin
- 6.93%
- Median
- 6.68%
- Pinnacle alone
- 4.10% (398 matches)
The matches kicked off between 19 September and 29 October 2026, with 20.5 books per match on average. Pinnacle quoted 398 of them, and its margin sat well below the all-book average.
The prices were taken before kickoff, not at the close. For the 454 finished matches with a scored tip, the snapshot came on average 20.2 hours ahead of kickoff. Margins at the close can differ, so these figures describe the feed, not the market's final price. The all-book average also mixes sharp and soft bookmakers, which is why Pinnacle has its own column below.
| League | Matches | Average margin | Pinnacle only (matches) |
|---|---|---|---|
| UEFA Nations League | 96 | 7.14% | 3.82% (28) |
| Italian Serie A | 43 | 6.21% | 3.53% (43) |
| Spanish La Liga | 33 | 5.89% | 3.52% (31) |
| French Ligue 1 | 32 | 6.05% | 3.45% (29) |
| UEFA Conference League | 31 | 6.63% | 5.02% (30) |
| UEFA Champions League | 31 | 5.47% | 3.79% (31) |
| English Premier League | 30 | 5.88% | 3.52% (26) |
| UEFA Europa League | 30 | 6.19% | 4.07% (30) |
| Swedish Allsvenskan | 27 | 7.79% | 5.02% (24) |
| Dutch Eredivisie | 26 | 7.92% | 4.40% (20) |
| German Bundesliga | 25 | 6.23% | 3.58% (25) |
| Turkish Super Lig | 19 | 7.83% | 4.16% (17) |
| Belgian Pro League | 16 | 8.87% | 4.37% (12) |
| UEFA Women's Champions League | 16 | 10.32% | 7.78% (16) |
| Portuguese Primeira Liga | 15 | 8.75% | 4.19% (12) |
Pinnacle's margin runs from 3.45% in Ligue 1 to 5.02% in the Conference League and Allsvenskan across 14 of the 15 leagues. The women's Champions League is the exception at 7.78%, and its all-book average of 10.32% is the highest in the table. Leagues with fewer than 15 matches (MLS, the Scottish Premiership and Brazilian Serie A) are left out.
The highest single-match average in the set is 11.46%, in the Belgian Pro League. The data shows that the gap between books exists. It cannot show why.
What to do with a margin-free price
The point of the arithmetic is comparison. A probability from any source, a tipster or a model, can be set against the margin-free price, and its stated confidence checked for calibration against results. The same conversion sits underneath closing line value, which compares the price you took with the price at the close. It sits under the break-even maths of tip accuracy too, where a win rate means nothing until it meets the price.
Machines need the same benchmark. The WC2026-Agents benchmark, covered in our post on ChatGPT and sports predictions, scored four language models against the pre-match betting market's Brier score, and that comparison is only fair once the market's margin is out. A bot that bets at the average book pays the margin on every bet before it has an opinion. The review of AI betting bots weighs that hurdle.
By hand, in four lines
- Write each price as 1 ÷ price.
- Add the results. Whatever the total is above 1 is the margin.
- Divide each result by the total to get the proportional probabilities.
- Compare those with your own forecast, and leave the raw prices out of it.